

A Commentary On Goalie Strategy
Goalies have long been considered risky investments in fantasy hockey due to their unpredictability. However, dismissing them entirely may not be the best strategy.
For years, fantasy hockey managers have faded goalies, labeling them as risky investments due to their unpredictable nature. This approach, often called Zero-G, advocates for drafting skaters in place of goalies and relying on waiver wire pickups to fill goaltending needs throughout the season. However, this churn-and-burn strategy has its pitfalls, often overlooked in favor of anecdotal success stories.
Rarely discussed is how much this churn-and-burn strategy backfires.
The backbone of my critique against extreme strategies lies in the assumption that goalies are inherently bad investments, while skaters are safe bets. This binary thinking lacks comparative skater data and overlooks how often high-draft capital skaters also fail. For every Charlie Lindgren success story, there's a cautionary tale like Adin Hill, whose early-season performance gave way to the whiplash of Logan Thompson’s performances and then again back to Hill.
__
I set out to validate my concerns with data, not to advocate for high draft pick goalies, but to emphasize the importance of drafting a goalie with the intention of keeping them for the season. This approach, which I refer to as "Hero-G," challenges the assumption that goalies are always volatile and skaters are consistently reliable.
Zero-G remains a valid and applicable strategy. There will always be applications for different strategies. There were parts to the strategy I saw as problematic and added risk to a strategy intended to mitigate risk.
__
My critiques were simple:
- 1. Inefficiency of Streaming Capital: The strategy of maximizing fantasy points by favoring mid-round skaters over goalies at the draft, with the intent of relying on the waiver wire for goaltending, is not cost-effective. The streaming capital required to manage this approach often outweighs the benefits.
- 2. Trust Issues: Claiming that goalies are untrustworthy on draft day yet relying on them throughout the season is contradictory. Applying the same in-season evaluation metrics to the preseason can offer more stability and allow managers to focus their streaming efforts on skaters
- 3. Skater-Goalie Comparison: High draft capital skaters fail just as often as goalies. In 2023-24, for every Andrei Vasilevskiy, there was a Jack Hughes. For every Alexandar Georgiev, a Tim Stutzle. Drafting a volume goalie in the mid-late rounds and keeping them offers more stability than constantly cycling through goalies.
To prove this we need to quantify the following:
- Do skaters have a better Return on Investment (ROI) than goalies?
- If so, by how much?
__
My preferred strategy differs from Zero-G on a fundamental level. I advocate for drafting a goalie you intend to keep all season, emphasizing the importance of getting it right at the draft table. Use the same evaluation metrics you would for in-season Zero-G options. This continuity at the goalie position allows you to stream skaters throughout the year, rather than consistently cycling through hot goalie performances.
Zero-G emphasizes “riding the hot hand” from the waiver wire, but it overlooks that the same logic should apply to your skaters. Every pickup used on a goalie instead of a skater diminishes the upgrade gained at the draft.
The “Hero-G” strategy prefers drafting a volume starter to set-and-forget, even if it costs more on draft day. This approach frees you to consistently stream skaters.
It also avoids the distraction of having to fix your roster in the first few “panic weeks” of the season. During these weeks, when the community often overreacts to slow starts from stars like Roman Josi or Connor McDavid, GMs hyperfocus on perceived inefficiencies. By securing a reliable goalie from the start, you can devote your full attention to capitalizing on skaters who slipped through the draft.
Skaters under 50% drafted who finished the year as Top-50/75 skaters:
- Boeser: 4G in his first game
- Rob Thomas: 4 pts in his first 5GP
- Vatrano: hattrick in Game 2 another in Game 8 // 5G in his first 6GP // 9G in his first 9GP
- Matheson: 6pts - 5 on the PP, over 3SOG/gm, ATOI over 24 in his first 10GP
- Nyquist: 12pts in 13gp in November
- ROR kicked off with a 2pt game, had 18 pts in his first 20GP
- Jarvis: 9pts (4PPP) in his first 10GP and almost 20 mins ATOI
These skaters likely didn’t last long on the waiver wire. Being distracted by goalies in free agency, even slightly, puts you at a disadvantage when shopping for skaters. The difference between these early-season skaters and a goalie like Jonas Johansson or Adin Hill is that the skaters were not dropped again. A GM with a solidified goalie on their roster can choose between one or two of these skater options, while someone who punted even one goalie slot might only have the flexibility to choose between a goalie and one skater. If they punted both goalie slots, they might miss out on these valuable skaters entirely.
Intentionally handicapping a position creates a necessity to address it later. Drafting with balance gives you the flexibility to address any position as needed.
Here’s a few more with rank in FHFH leagues:
- Barzal - 73% drafted, finished ranked 46
- Kadri - 80% drafted, finished 51st
- Weegar - 86% drafted finished 54th
- Caulfield - 83% drafted, finished 74th
- Owen Tippett - 64% drafted finished 89th.
- Forsberg - 75% drafted, finished 8th
If you’ve just completed a draft and feel confident about upgrading your skaters by punting goalies, you might think that addressing your skaters immediately is unnecessary. These upgraded skaters were likely drafted in rounds where the Sunk Cost Fallacy is said to prevent you from letting go of high-cost investments.
While it might seem reductive and hyperbolic, the reality is straightforward: you’re probably hyper-focused on finding a goalie savior and convinced your skaters are already as good as they can get.
___
I’ve spent a considerable amount of time writing dozens of Python scripts, compiling data from both Yahoo’s and the NHL’s API, and analyzing over half a million rows in my Google Sheets—all to my wife’s amusement.
Despite the initial frustration of seeing my takes and opinions used out of context, I’ve found joy in the process. Diving deep into the data and creating meaningful analysis has been incredibly rewarding.
After taking a year off for my family and mental health, it’s awesome to feel that spark again. I’m truly enjoying being immersed in fantasy hockey once again.
__
Before sharing my findings, let’s first address some key points:
Scoring significantly impacts the application of a Zero-G strategy. It’s important to note that some form of Zero-G will always have relevance. I’m not advocating against using Zero-G altogether.
However, I believe drafting goalies with the intent to drop them for waiver wire talent is unwise and unlikely to yield a net positive result. Goalies available in the draft tend to be less risky and have a larger sample size to build trends from, with more pedigree than those found on the waiver wire.
Finding value late in the draft and spending less than your opponents is a strategy that applies to both skaters and goalies. There is considerable overlap between Hero-G and Zero-G in seeking late-round value.
The primary difference between Hero-G and Zero-G lies in what you plan to do with the goalie you draft. Hero-G has no problem spending an extra round to secure a better tier goalie, understanding that the value gained from streaming skaters will offset any perceived draft day “deficit.”
The strategies diverge significantly: Zero-G aims to secure their #1 goalie later in the season in Free Agency, while Hero-G focuses on drafting a reliable goalie on the early side of the middle of your draft. Hero-G is not about drafting top-tier goalies like Shesterkin or Vasilevskiy but about identifying value picks like Binnington and Demko.
Hero-G is not foolproof. There will be times when it doesn’t work—every Demko has a Jack Campbell who flops despite having all the right ingredients. There is an inherent randomness in fantasy hockey that affects all positions, as any Tage Thompson owner can attest.
Zero-G is the belief that, due to the volatility of the goaltending position, you can find a top-flight goalie on the waiver wire or at the very end of your draft. These goalies can provide stretches of performance that rival top draft picks, with the hope that they become long-term holds. The strategy emphasizes spending as little as possible, so there’s no buyer’s remorse when a goalie flames out, allowing for guilt-free swaps of low-cost goalies.
Value drafting or value hunting should be applied regardless of the strategy name.
It also depends on what denomination of the Church of Zero-G you’re in, there are many branches popping up:
- The OGs: Punting goalies is the true Zero-G
- The Evolutionists: Fading goalies is the true Zero-G
- The Crusaders: folks convinced that any instance of a goalie beating their ADP is True Zero-G, and any dissenting comment is heresy.
As an OG, I define Zero-G as punting goalies, not fading or value drafting goalies.
The core difference between Hero-G and Zero-G lies in our draft plans. I trust preseason macroanalysis to identify a volume starter, while Zero-G relies on in-season microanalysis to find shifts in net-share toward under-the-radar goalies. My strategy aims to land a reliable starter like Demko or Bobrovsky from the outset.
Let’s get into it.
__
While studying Zero-G, I noticed the usage of the Keeping Karlsson’s KKUPFL scoring format. When studying their scoring I noticed this:
- Top 5 Skaters Average fPts: 670.35
- Top 5 Goalies Average fPts: 364.08
There is a 46% handicap on a goalie’s ceiling, while skaters are 184% more impactful. These figures alone clearly indicate that drafting a goalie early is a poor investment.
Given how muted goalies are compared to the overpowered skaters, I was surprised to learn that Igor Shesterkin and Andrei Vasilevskiy had KKADPs of 42.4 and 48, respectively. Perhaps it’s a VORP (Value Over Replacement Player) issue.
__
I grew up with the scoring format here at FHFH:
G: 3, A: 2, SOG: 0.2, PPP: 1, SHP: 1, SHG: 1, HIT: 0.2, BLK: 0.25
W: 4, SV: 0.2, GA: -1, SO: 3
Our scoring format has even garnered praise from Evolving Hockey. Josh and Luke set out to create Fantasy Hockey Projections and Rankings back in 2021. While considering a default scoring to use, they asked various podcasts and pundits about their scoring systems. They eventually landed on ours.
"Toying around with various sets of metrics and weights, and we’re thinking we’re going to use the ones you suggested for our default rankings. They’re a very solid / average set overall, and the lower SOG weight compared to some other leagues or sets is a nice balance so you don’t get crazy weird results."- in DMs with Evolving Hockey
Seeing that 54% disparity between skaters and goalies in KKUPFL, I had to analyze our scoring too:
- Top 5 Skater Average fPts: 440.83
- Top 5 Goalie Average fPts: 315.72
While not perfect, the FHFH Points format reduces the goalie handicap to 28%, which feels appropriate. I don’t expect Hellebuyck and MacKinnon to be equally valued, and a 28% difference is acceptable.
In a previous study, I analyzed the impact of draft position versus waiver wire (WW) activity on end-of-year (EOY) finishes in a 12-team league. Top-half draft positions had a 9% better chance of winning the league.
However, league winners had 53% more WW activity. First-place teams had 222% more transactions than the average of the bottom-6 finishers and 359% more transactions than the bottom-3 finishers.
Top-half teams made twice as many WW transactions as the bottom half, and first-place teams had 6.5 times more than last-place teams. This underscores the importance of streaming capital relative to draft capital. Zero-G relies on a portion of your streaming capital be allocated to goalies.
You don’t win your league at the draft, but you can certainly lose it there. Both Hero-G and Zero-G agree that drafting a goalie in the early rounds often hurts your team. You win by maximizing games played, and drafting a long-term goalie helps achieve this.
__
2023-24 Top 10 Goalie Performances by Week:
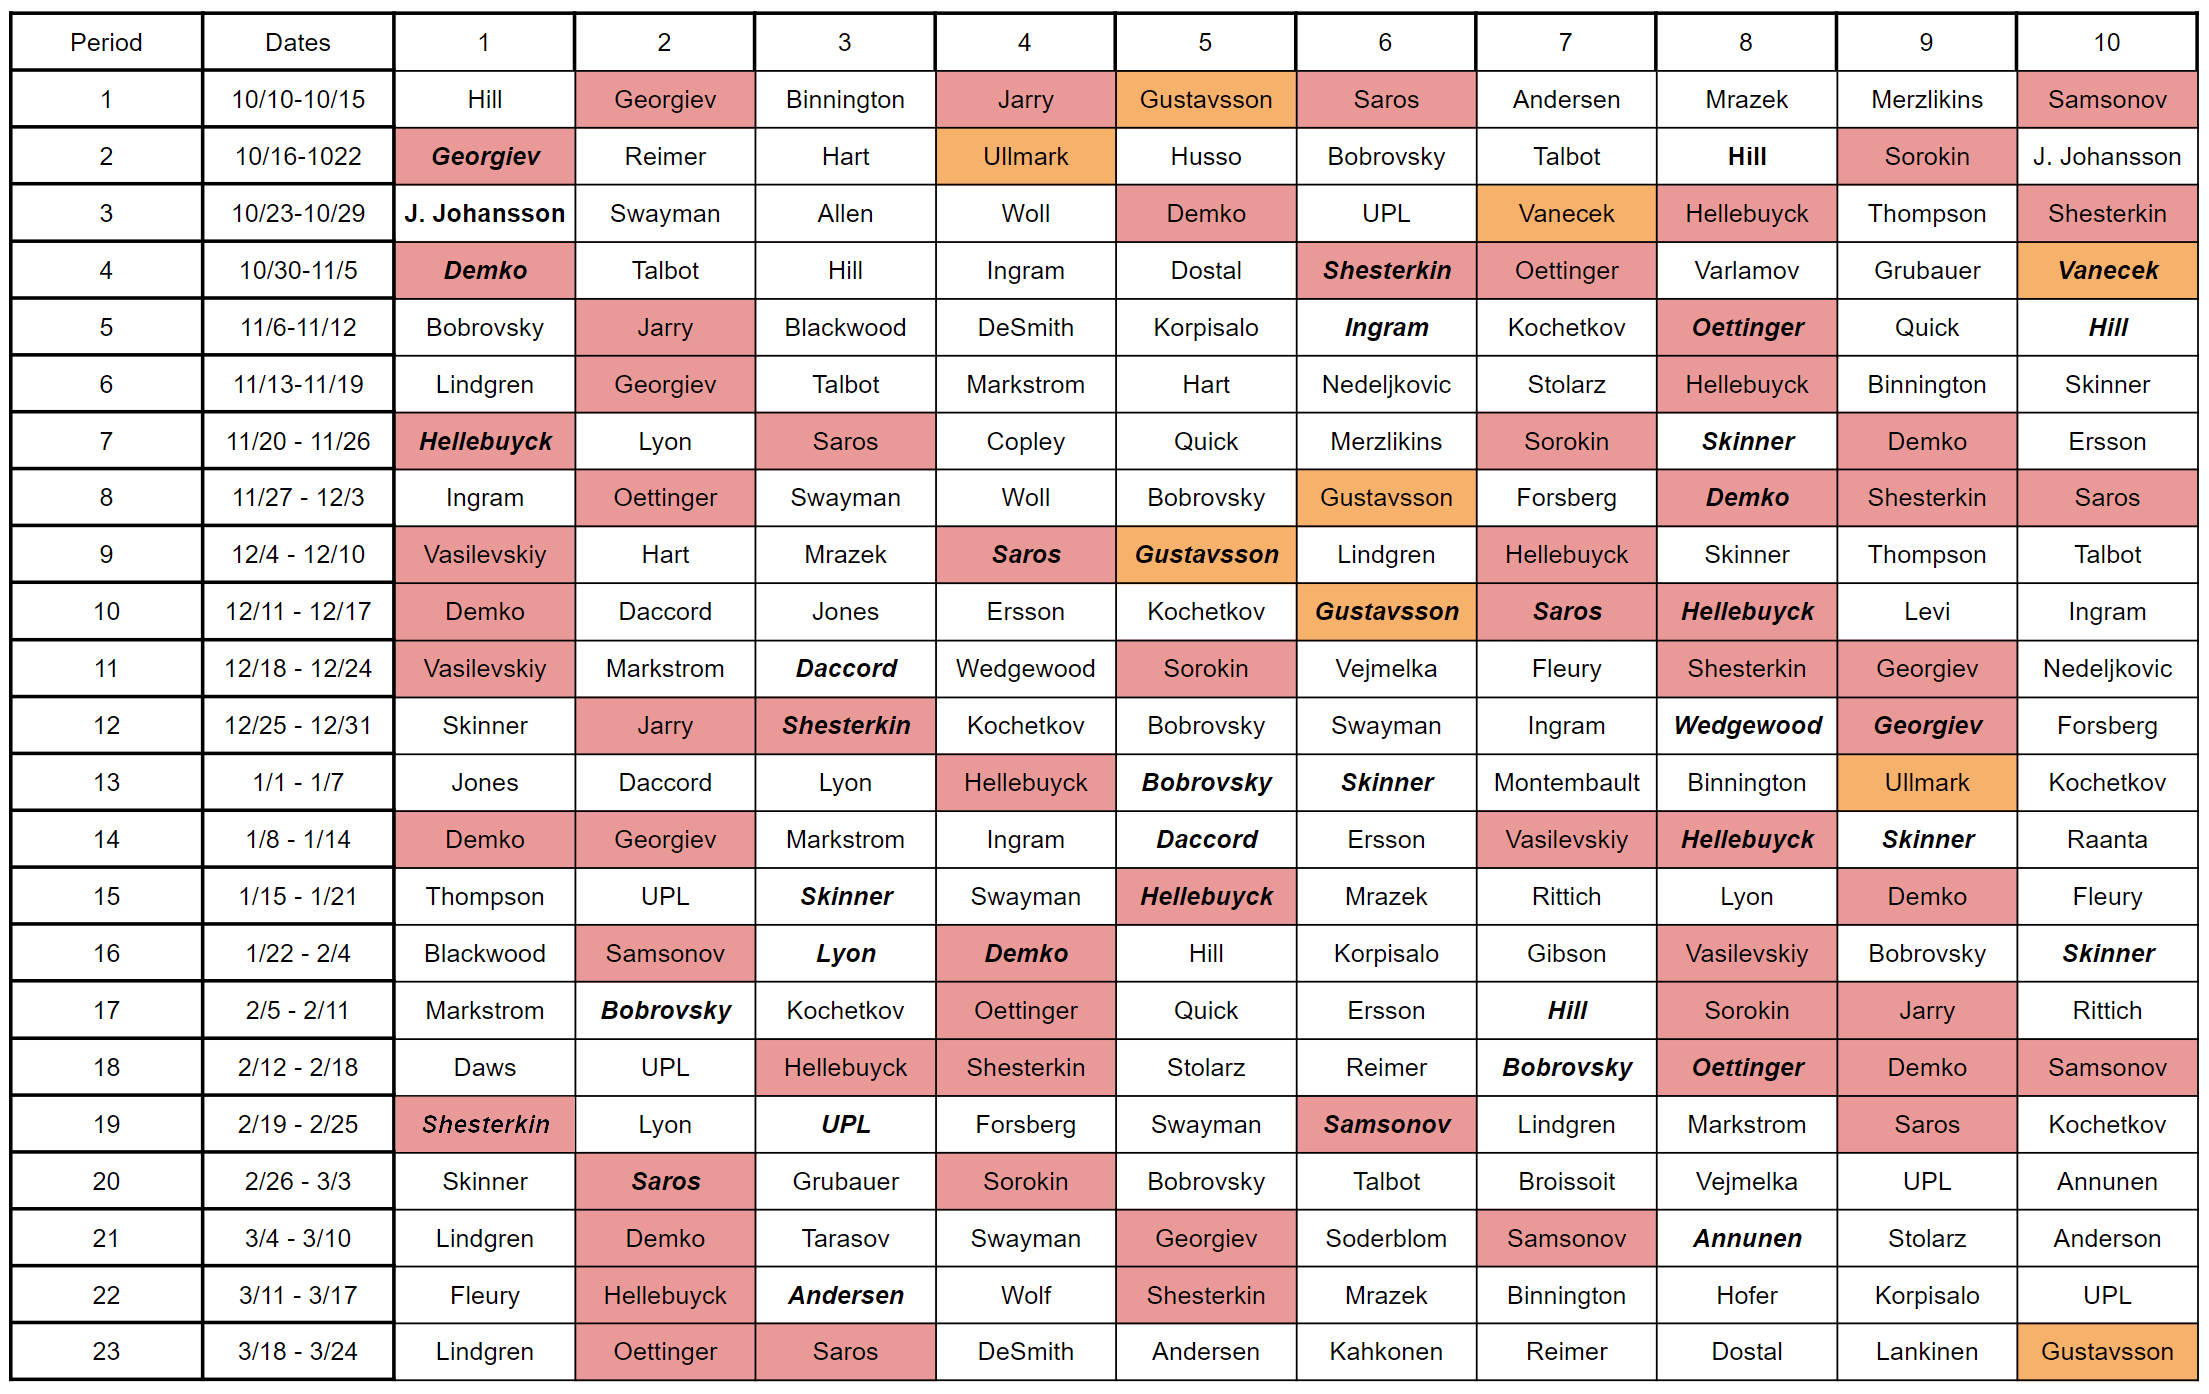
I highlighted goalies with KKUPFL ADPs inside the top 10 in red and those ranked G10-G14 in orange. Bold, italicized names indicate back-to-back top-10 performances, showing the stretches of relevance for each of these top-10 goalies.
In total, I found 41 instances of sustained top-10 performances, 19 of which were from goalies outside the top 14 by KKADP—less than half were outside the top 14.
While not impossible, repeated top-10 performances are just as likely from top-10 or top-14 goalies as they are from goalies drafted later. This counters the belief that it’s easier to pick up a goalie for a top-10 performance than it is to draft one. The data is almost evenly split between “expensive” top goaltending and “value” goalies.
__
Back to Back Top-10 Performances:
- Alexandar Georgiev (2), Adin Hill (3), Jonas Johansson, Thatcher Demko (3), Igor Shesterkin (3), Vitek Vancek, Connor Ingram, Jake Oettinger (2), Connor Hellebuyck (4), Stuart Skinner (5), Juuse Saros (3), Filip Gustavsson (2), Joey Daccord (2), Scott Wedgewood, Sergei Bobrovsky (3), Alex Lyon, Ukka-Pekka Luukkonen, Ilya Samsonov, Justus Annunen, Frederik Andersen
Stuart Skinner stands alone as a true league winner from the waiver wire, and kudos to those who snagged him. He was an 8th-round pick, drafted in 100% of Yahoo leagues, making him difficult to pick up.
Zero-G GMs aren’t the only ones looking for top-performing goalies on the waiver wire, so competition can be tough. If there was a Top-10 goalie on my waiver wire, they would be hard to ignore, regardless of my roster composition. The idea that “not everyone will be looking for a goalie” is baffling. I’ve never seen someone pass up a Top-10 player at any position especially one with long-term upside.
Adin Hill was a good pickup while he was a top-10 goalie, but Logan Thompson also had notable stretches for Vegas, and Hill had periods of injury.
Thompson made three Top-10 appearances: one was between Hill’s Top-10 performances, another was as the top goaltending option, and the third was followed by back-to-back Top-10 weeks from Hill. You don’t need to be struggling as a goaltender to have starts “stolen” from you; shifts in starts can be unpredictable.
This brings me to my next critique: “Evaluating goaltenders in-season is easier than at the draft.”
I see this differently. While evaluating goalies game-to-game might be easier, my concern lies with the macrodata—week-to-week or month-to-month performances. The stability of this macrodata allows us to focus on more critical areas of our roster, such as our streaming spots. You simply won’t find a 60+ start goaltender on the waiver wire. With approximately 22 weeks in a fantasy season, that equates to around three starts per week. Additionally, avoiding the constant headache of updating and gambling on the most volatile position in hockey saves both time and stress. Goalies are the only position in most leagues that can deliver negative value in a week, and the demographic of goalies on the waiver wire are just as likely, if not more likely, to underperform compared to their counterparts who were available only at the draft.
__
A Mirror Argument: Evaluating Goalie Performance with Game Played Stats
Zero-G advocates often seek under-the-radar goalies who are gaining volume and stealing starts. With that in mind, consider this:
Among the Top-10 Goalies by End of Year KKUPFL Rank, only 2 were not among the Top-10 Leaders in GP in the NHL. Those two goalies were Oettinger (G12) and Demko (G16), both of whom missed time due to injuries. Even Petr Mrazek, who was in the Top-10 for GP, finished 14th in KKUPFL.
If a single stat like GP can reflect fantasy performance with an 80% EOY match, we can exploit this to evaluate goalies before the draft.
In fact, we are better suited to make these evaluations in the preseason rather than in-season, when goalie start decisions are often made last minute, sometimes even an hour before game time.
While it’s challenging to project any NHL player without hindsight, learning from past patterns can significantly improve our draft strategies. Those who fail to learn from history are doomed to repeat it.
___
Let’s take a fun trip back to draft day, imagining ourselves as our younger, more carefree selves:
You’re on the clock and haven’t researched goalies at all. In a scramble, you pull up NHL.com, go to stats, click on Goalies, extend the date range to three years, and sort by games played.
Top-10 Goalies in GP over the last 3 years:
- Hellebuyck, Saros, Markstrom, Vasilevskiy, Shesterkin, Gibson, Jarry, Kuemper, Binnington, Oettinger.
Fast forward to the day after the Championship. Pull up Yahoo or Fantrax, check your league, go to players, and you sort by Top G:
Top-10 Goalies by KKUPFL EOY Rank:
- Hellebuyck, Bobrovsky, Saros, Shesterkin, Binnington, Demko, Sorokin, Georgiev, Skinner, Oettinger.
Surprisingly, five out of ten are a match! And all it took was one metric—GP. That’s a 50% success rate.
Back to draft day: Suppose you wanted to use two data points. This calls for Natural Stat Trick. You go to NST, click on goalies, look at last year’s totals, aaaaaaaaaaaand….. sort by GP:
Top-10 Goalies in GP in 2022-23:
- Saros, Hellebuyck, Georgiev, Oettinger, Sorokin, Binnington, Vasilevskiy, Markstrom, Shesterkin, Kuemper.
Well hot dog, a 7 out of 10 match?! You can barely swing a stick in here without hitting a Top-10 Goalie!
(I am severely sleep-deprived)
All jokes aside, using something like total GP as the sole metric of evaluation we could have predicted half of the Top-10 EOY goalies over the last three years—and 70% using 2022-23 GP data. Imagine how those percentages would improve with an additional data point.
Consider factors like a team’s backup goalie, defensive setup, penalty kill efficiency, and penalty frequency. Incorporating these data points can further refine this 50-70% template for evaluating goalies. This approach demystifies or de-voodoos goalie evaluation and increases draft day accuracy.
___
“What about the rise of the tandem goalie?”
Over the past three years, the top-10 leaders in games played (GP) in the NHL averaged 50.8 GP per goalie. Excluding the COVID-shortened season and looking back to the lockout season (2012-13 to 2019), the average was 50.3 GP per goalie. This indicates a slight increase, not a decrease.
Even if it doesn’t feel like it, the workhorse goalie is not dead. While the 73-game seasons of goalies like Cam Talbot in Edmonton may be rare, volume remains a consistent factor in top goalie choices both in-season and on draft day.
__
Now to perhaps my strongest argument:
Every waiver wire pick spent on a goalie instead of a skater hurts your Ceiling
Extreme applications of Zero-G can expose you to this as a necessity, rather than choosing to stream a goalie
__
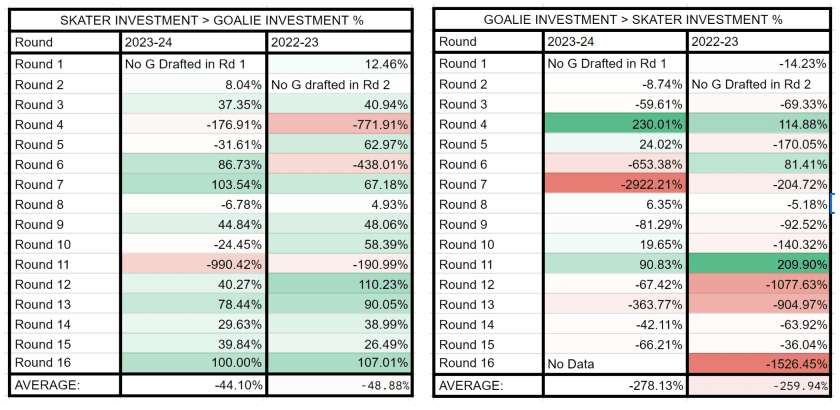
Using the KKUPFL scoring format I have found the following:
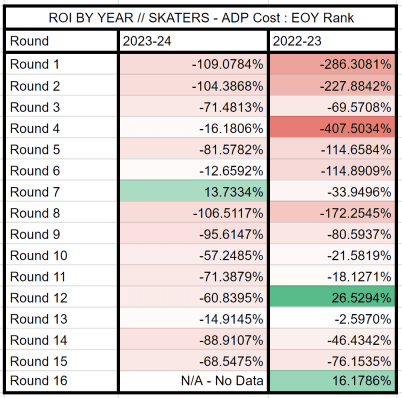
At first glance, this chart might remind you of the chart in the original Zero-G Thesis showing just how poor an investment drafting a goalie can be.
This is the ROI% of skaters by round in the KKUPFL. Skaters often disappoint, but the pitchforks are solely pointed at the goalies.
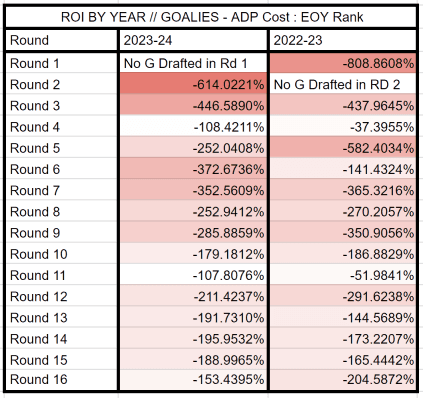
For transparency, here is the ROI% for goalies:
__
Goalies are indeed a bad investment, and by a fair margin, they are worse than skaters. However, using the same numbers and formula, skaters also often fail to provide a good return.
Anyone who noticed the nearly 50% ceiling handicap baked into KKUPFL goalie scoring should have faded goalies without hesitation.
A key pillar of my critique of Zero-G is the lack of comparative skater data. Again, to reiterate: for every Vasilevskiy, there is a Jack Hughes; for every Georgiev, there is a Thompson, for every goalie there is a corresponding skater. As goalie ADP shifts in the draft to be later and later overall, high draft capital skater flops continue to happen with a 1st round price tag while goalie price points and initial investments fall.
__
How do you quantify the benefits of fading a goalie? Specifically, how do the fantasy points gained by drafting a skater in the 8th round and waiting until the 13th round to take a goalie compare to a team that took a goalie in the 8th round?
Is there a way to determine how many times I would need to forego streaming a skater to correct the goaltending position?
I wanted to find out:
How much better was it to invest in a skater, and how did that compare to streaming goalies throughout the season?
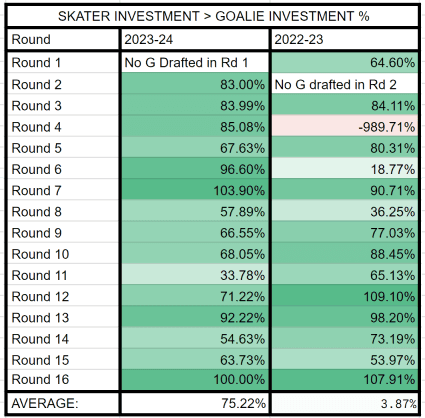
In 2023-24, GMs saw a 75.22% better return on their skater investments than on their goalie picks. Given the 184% tilt towards skater scoring, it’s worth questioning whether this is due to the inherent nature of the positions or if the scoring format is skewing the results. It feels like the odds are heavily stacked against goalies—throwing into question the merits of applying a Goalie Punting strategy in leagues where Goalie Scoring isn’t at an almost 200% handicap.
In 2022-23, Gabriel Landeskog’s injury significantly impacted overall fourth-round skater investments. This outcome wasn’t due to poor evaluation but rather bad timing and luck.
Regardless of the reason, a fourth-round pick was invested and did not yield the expected return. In fantasy hockey, there’s no insurance or warranty to cover such losses, making it a bad investment.
To avoid cherry-picking data or excluding injured players, I calculated these numbers by drawing lines in the ADP ranks for a standard 12-team league. Using an aggregate of the FHFH and KK in-house ADPs, along with Yahoo! ADPs, I created a single holistic ADP. Players with an ADP of 0-12 were considered “Round 1 Draft Picks,” those with 12.01-24 ADPs were “Round 2 Draft Picks,” and so on. I then averaged the fantasy points (fPts) total and end-of-year (EOY) rank for each round, similar to the Zero-G comparison of G1-G14 and G15-G28, but with more granularity.
One notable difference is that I didn’t compare SKT1-SKT14 to SKT15-SKT28 as Zero-G did with goalies. This is because G1-G14 spanned an ADP range of rounds 1-6 (12-71 ADP), and G15-G28 spanned rounds 6-11 (73-128 ADP). The skater sample to match these goalie buckets at the 0-71 ADP range vs. the 71.01-128 ADP range was too broad and didn’t seem comparable. There are simply so many more skaters relative to goalies. Mixing top players like McDavid and Kucherov with players like Jesper Bratt and Joe Pavelski didn’t feel appropriate. It felt more accurate to analyze by round.
I also used total points instead of points per game because one of the defining characteristics of a good goalie is volume. Unless you’re in a qualitative goalie stat league, quantitative stats often overshadow or drown out poor showings. We want a goalie who plays 2-3 times a week, and as the hypothetical Venn diagram of goalies who perform well on a game-to-game basis and those valuable in fantasy hockey is almost a circle.
___
Here are the ROI% comparisons for anyone curious of FHFH Points leagues. Mostly to show how different scoring formats can affect Zero-G applications:
This was what was most surprising. It explained a lot of my biases on why I have felt so strongly about the narrative of Goalies being downplayed and devalued in drafts. It's a classic case of Nurture vs Nature. The format I am accustomed to is a lot friendlier to Goalies than KKUPFL.
__
Some observations with FHFH scoring:
In 2023-24:
- Rounds 4, 5, 8, 10, and 11 goalies had better ROI than skaters.
- Round 2 skaters outperformed round 2 goalies by just 8%.
- Late-round goalies almost never returned a positive ROI.
- Late-round skaters were far better investments than goalies in rounds 12+.
- Round 1 ROI was cratered by Jack Hughes and Tage Thompson, the only skaters who provided positive ROI were Mackinnon, Kucherov, and Matthews. 3 out of the Top-12.
In 2022-23:
- Rounds 4, 6, and 11 goalies outperformed skaters (Round 4 likely due to Landeskog injury).
- Cale Makar significantly lowered Round 1 ROI. (I seem to remember someone warning us about this)
- Round 12 for skaters was exceptional with Karlsson, RNH, Tage, Keller, Larkin, Sergachev. We might never see a more valuable round than this.
Despite these findings, I’ve gained valuable insights into the nuances of fantasy hockey and have thoroughly enjoyed the process. Ultimately, success boils down to picking the right player at the right time and mitigating loss. Winning a matchup often means ‘losing less’ than your opponent.
Out of the top 250 players, 175 returned a negative ROI, and only 75 returned positive value—70% of all picks at all positions were bad investments on some level.
The premise is simple: skaters are better investments than goaltenders. This strengthens the argument for streaming skaters instead of goalies.
In leagues not counting negative PIM or +/-, the worst game a skater can have is 0 points. Goalies, however, can actively hurt your team. Diversifying your goalie portfolio increases your exposure to risk and variance.
__
How many points are lost by ‘riding the hot hand’ and using pickups on goalies who only have 46% of the top-end point potential compared to skaters?
If skaters score 186% more, shouldn’t all streaming efforts focus on them?
Can this strategy maintain the upgraded fantasy points totals achieved by fading goalies at the draft?
This was the hardest part to quantify.
How do you challenge a seemingly bulletproof argument?
By demonstrating that even the best possible outcome of a goalie streaming season still results in a net negative.
__
The Zero-G Google Sheet available to Subscribers of the Apples and Ginos Patreon breaks the season into eighths (I will be referencing them as: E1, E2, E3, etc.).
The ease of "hitting" on a WW Goalie has been conveyed by leveraging 41 top-10 Goalies performances who emerged in at least 1 Eighth (E) of the year. 5.125 average options per E.
To reiterate for those still not confident in drafting a goalie: Volume and goalie fantasy performance typically go hand in hand, even for goalies with bad rate stats.
- Scott Cullen, maybe the most respected fantasy hockey projector - his top-10 goalies going into the draft matched 70% of EOY KK ranks when plugged into FreshSheets.
- Of Scott Cullen's Top-10 projected Goalies using Rhys Albrecht's FreshSheets and the KKUPFL scoring, 8 can be matched to the previous year's Top-10 GP leader list.
- Apples and Ginos had 6 of their 7 Tier-1 goalies that finished in the top 10 of GP the previous year. Had Vasilevskiy played a full year, it would likely be 7 for 7, but he finished 17th.
- Bobrovsky, Demko, Skinner, and Binnington were the only ones missing from the top 10 and they were in Tiers 3, 2, 2, and 6, respectively.
By using only GP leaders from the previous year, or previous few years, this will give you a boilerplate starting point for predicting at least half of EOY Top-10 Goalie Finishes.
Doing more research into defensive environments, trends and depth charts will only increase your probability of landing one of these Top-10 EOY Ranked Goalies.
20 for an Eighth
There are eight segments (E’s) in a season, with 41 Zero-G candidates averaging 5.125 Top-10 options per segment.
At the time of writing, I reached out to Nate to confirm the exact dates for these segments so they could align with the goalie date ranges in the analysis. Unfortunately, Nate was camping off-grid and didn’t see my message until last night. I will update the analysis accordingly once I have the correct dates.
For now, we’ll use the date ranges my algorithms calculated. Based on the “Why Zero-G is Still King in 2024” episode, I used the 24-day interval that was mentioned. If the ranges differ, I will update my analysis.
I wasn’t sure how to proportionately convert the top skaters to match the top 10 or 14 goalies. Instead of setting an arbitrary threshold, I wanted to determine how many skaters outperformed the Best Goalie Option (BGO) in a given week. My goal was to assess whether there are truly more viable goalie options than skater options for streaming both in terms of quality and quantity.
This is going to be a lot to unpack, I know.
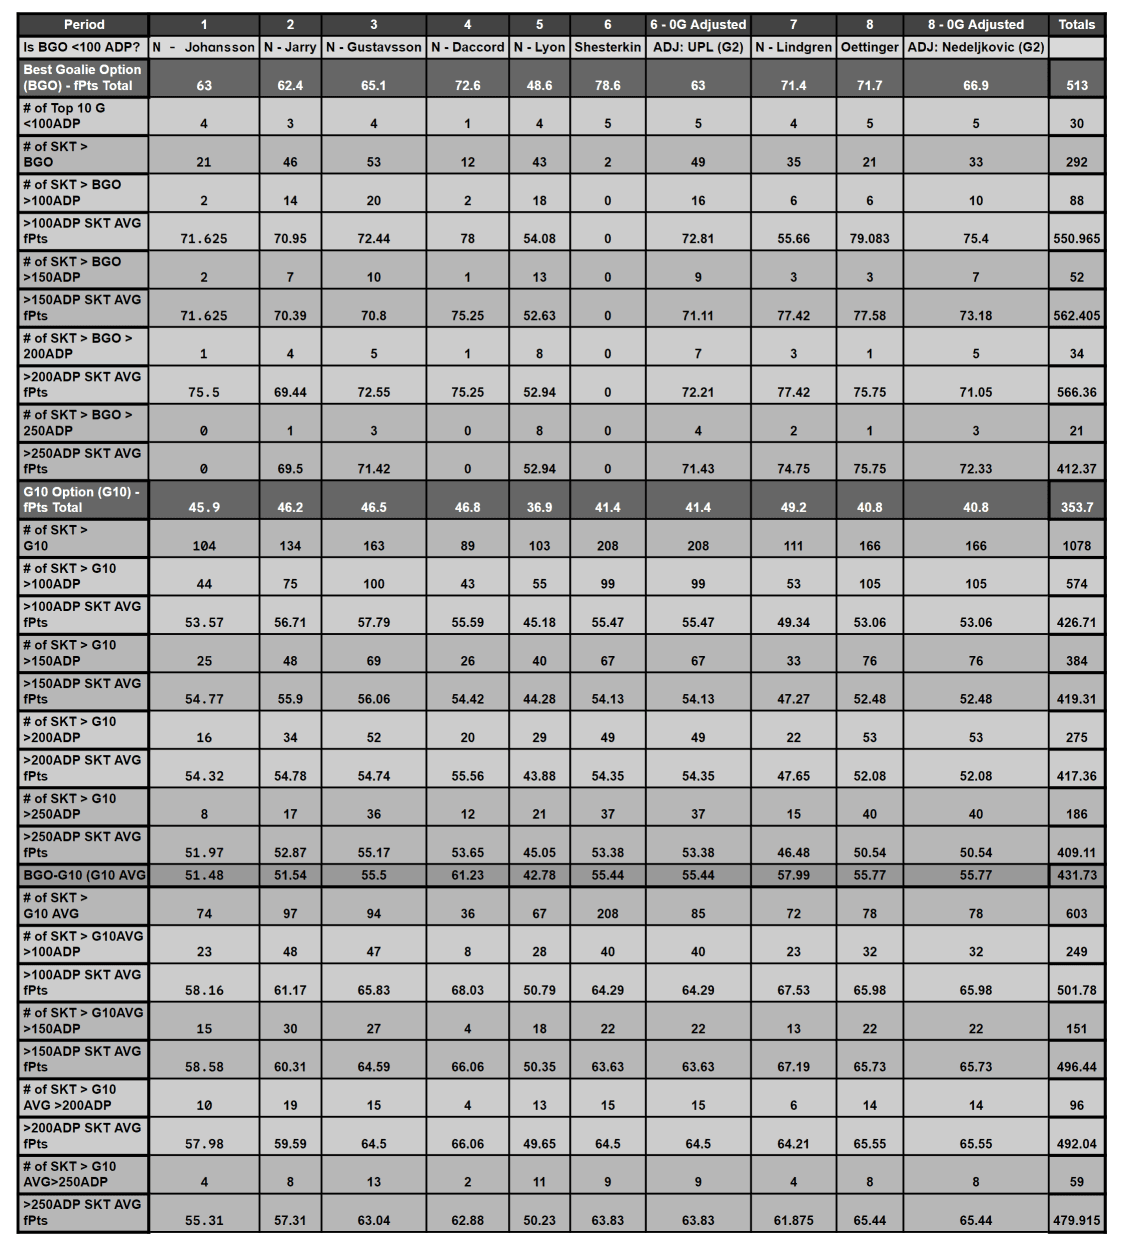
The columns represent each Eighth (E), with the Best Goalie Option (G1 or BGO) fPt total at the top. I then totaled:
- Total Skater Options better than the BGO
- # of Skaters with an ADP >100 who performed better than the BGO
- # of Skaters with an ADP >150 who performed better than the BGO
- # of Skaters with an ADP >200 who performed better than the BGO
- # of Skaters with an ADP >250 who performed better than the BGO
- I then repeated the same process with the 10th Ranked Goalie (G10) as well as the average fPts total of G1-G10.
- If the BGO was not Zero-G compatible like Shesterkin or Oettinger, I defaulted to the top Zero-G option. I displayed both however for comparison.
There are a few caveats to consider. First, the previously mentioned date ranges might not align with A&G’s date ranges, potentially leading to an unequal comparison of games played (GP) between skaters and goalies.
Additionally, the nature of KKUPFL scoring devalues both the draft capital spent on goalies and the payout from goalie streams.
This analysis also does not account for player ownership availability during a given period. It’s based on the similar assumption that you could always grab a player like Stuart Skinner or be the only GM in the market for a top-10 goalie. Similarly, it assumes that skaters in the specified ADP buckets were 100% available.
Findings:
Twice, there were no skaters with an ADP over 250 who outperformed the Best Goalie Option (BGO)—Jonas Johansson in Week 1 and Joey Daccord in Week 4. Other than these instances, there wasn’t a single week where a goalie stream outperformed a skater stream. I wonder if this might change after matching up the date ranges.
This analysis focused solely on skaters who outperformed the best goalie in each respective period, not the best available goalie or some cherry picked criteria— the Best. Goalie. Option. Period.
Consider the sheer number of skaters in each bucket and how many players performed comparably. I find the >150 ADP row particularly useful, as it matches the range where a GM who avoided early goalies would likely draft a goalie.
Compared to 41 goalies on the year that made Top-10 appearances in at least one E:
- 292 skaters beat the best goalie option this year. Not "Top-10 Skaters", not Best Available Goalie Option. 292 skaters downright outperformed the Best. Goalie. Option.
- 88 were in the >100 ADP range.
- 52 were >150 ADP.
- 34 were >200 ADP.
- 21 were >250 ADP.
On average, there were 5.125 goalie options per E and 36.5 skater options per E.
Skater options who outperformed the best goalie are 7.12 times more abundant than Goalies.
What does a perfect season of goalie picks look like? 513fPts from Goalies.
How does it translate to total net fPts gained?
Imagine going from zero confidence in your ability to evaluate goalies on draft day to being 100% perfect in evaluating them as soon as the puck drops in Game 1.
In this scenario, we use the Best Goalie Option (BGO) for each E of the season, achieving an 8/8 success rate without any misses. This hypothetical situation allows the GM to start with Jonas Johansson in Week 1 and then move to Tristan Jarry (who, to be fair, had a KKADP of 108.2), and so forth—always selecting the top-performing goalie.
This perfect strategy would result in “hitting” on 100% of your seven acquisitions throughout the season, netting you 513 fantasy points (fPts) with just seven pickups—not the hyperbolic anecdote of “two per week”, just seven in total.
Conversely, skaters in the 200-249 ADP range would net 566.36 fPts. Even with perfect goalie evaluation, you’re at a deficit of 53.36 fPts over the season by choosing to stream goalies instead of skaters. Building a team reliant on the waiver wire for goaltending frequently leads to this streaming debt, unlike a team with a busy, set-and-forget goalie.
Just as there are bad weeks for a set-and-forget goalie, the same applies to high-draft capital skaters like Tage Thompson, Tim Stutzle, Jack Hughes, Jason Robertson, and others. These skaters can have disappointing seasons, and their owners must endure these bad weeks, just as we must with goalies. The argument that only goalies cause such frustration overlooks the reality that many high-draft skaters also underperform or have extended slumps.
__
Now it’s time for the math part. Who is excited?!?!
Does the skater upgrade we got in the 7th, 8th, or even 9th round by not taking a Goalie - make up those -53.4 fPts?
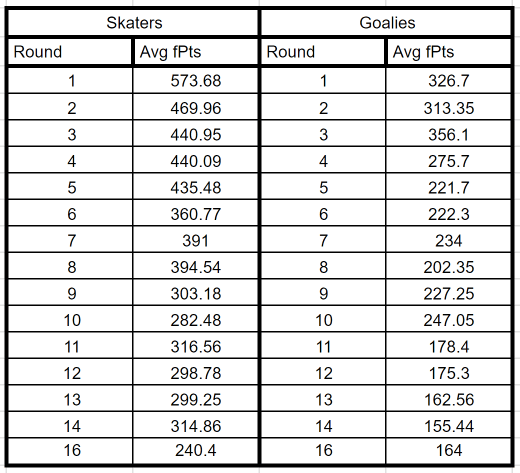
Here is the Average fPts per round of all skaters and goalies:
__
To compare the points upgrade of two teams based on their draft strategies, we need to consider the points scored by players drafted in specific rounds.
Team A drafts a goalie in round X and a skater later in round Y. Round Y needs to be considered because this is where Team B will be drafing their Zero-G goalie.
Team B drafts a skater in round X where Team A opted for a goalie, we will call this: S. It's the same Round, but different fPt total. Then and a goalie in round Y, which we will call: G.
In both cases, Team A and Team B took a Skater in Round (X+1) which we will call round Z.
For Team A, the difference between player S and a player in Round Z will be the "downgrade" they will incur as a consequence of drafting a Goalie in round X.
How much Team B has upgraded their team can be calculated by auditing the totals of Team A's choices in Goalie affected rounds and Team B's choices in the same rounds.
Team A: ( X + Z + Y )
Team B: ( S + Z + G )
The difference between the early goalie: (X + Z + Y), and the late goalie: (S + Z + G), should reflect both the impact of Drafting the early Goalie X and the next available Skater: Z, as well as the the perceived upgrade of having both S and Z by going Skater instead of Goalie.
( X + Z + Y ) - ( S + Z + G )
That was hard to explain and barely made sense even in my brain, I hope that made sense. It’s easier if I show you.
__
Pick any round you like and do the math yourself, but for the sake of argument I will explain it using Team A as my Hero-G team - drafting a goalie in Round 7. Team B, a Zero G team, will be taking a goalie in round 13.
Obviously your mileage may vary, and painting a picture with averages won’t be crisp. I am just hoping to outline the methodology and truly put a number to the theory.
Team A
- RD7 G: 234 AVG fPts - X
- RD8 SKT: 394.54 AVG fPts - Z
- RD13 SKT: 299.25 AVG fPts - Y
Team B
- RD7 SKT: 391 AVG fPts - S
- RD8 SKT: 394.54 AVG fPts - Z
- RD13G: 162.56 AVG fPTs - G
Team A Total: 927.79
Team B Total: 948.1
This implies that fading goalies to round 13, Team B improved their team over Team A by 20.31 fPts on average by fading 1 goalie slot.
If Team B is fading both of their goalies, you will have to do the equation again comparing the G2 Goalie Affected Round of Team A and B.
If Team B has a perfect 8/8 record on Goalie streams throughout the year, Team A will still have accumulated 53.36 more points than Team B via those 7 WW pickups on average.
Any single instance of Team B streaming a Goalie while Team A chooses to stream a skater - Team A closes the gap on the Draft Day Skater upgrade by 7.62 avg fPts.
The 20.31 avg fPt upgrade on draft day in this example is nullified by as little as 3 goalie acquisitions over the course of a year. Handicapping your Goaltending position to the extreme will increase your need to do this over the course fo a year.
In total on the season - an 8/8 perfect goalie stream record turns into a net of -33.05 fPts for Team B who chose the BGO every 1/8th of the season.
Using only 7 acquisitions all year, or 1 goalie swap every 3-4 weeks. Not 2 goalies a week, not daily spot streams. 7 swaps.
Team B can always stream skaters in between, but the chains have already been moved back.
__
I can only imagine that -33 would get larger if you happen to get a goalie stream wrong. Or if you went Zero-G for both of your Goalies. Something that’s rarely talked about in Zero-G. Even with a flawless year of getting every goalie stream right, and getting the G1 option every time we are still in the red. The circular logic of suggesting Goalies are too variant to get right at the draft, but simple to get right during the season is recursive. Shown here, even if it somehow works out perfectly, you do more damage to your team than good.
There have been benefits to these extreme strategies, for other GMs in their leagues it dilutes the Goalie ADP on draft day and allows us the opportunity to get better Goalies Options later at better value. Not only that, but in the above example - there would be 7 times in a year with one less hand in the cookie jar when I am shopping on the Waiver Wire for Skaters.
Conclusion
While the fading goalies to an extreme has long been favored for its ability to exploit the unpredictability of goalies, my analysis suggests that this approach may not be as effective as previously thought. By comparing the draft and streaming strategies for goalies and skaters, we see that:
- Skaters Provide Better Returns: Across the board, whether via Draft or Free Agency, skaters offer a higher Return on Investment (ROI) compared to goalies. In 2023-24, GMs saw a 75.22% better return on skaters than on goalies.
- Streaming Skaters is More Effective: Throughout the season, the availability and performance of skaters on the waiver wire significantly outweigh that of goalies. Skaters are 7.12 times more likely to provide value over goalies.
- Perfect isn't Good Enough: Even with a perfect record of streaming the 7 best goalie options each week, the points gained at the draft do not match the value lost by missing 7 skater streams.
- The math is clear: find a balance between Skater’s and Goalie’s Draft Day Cost by drafting a Volume Starter on a Good team as late in the draft as possible. This allows you to spend less Draft Capital and also hang on to as close to 100% of your Streaming Capital leads to a more successful fantasy hockey season. The draft day upgrade diminishes when considering the full picture of both Skater and Goalie data side by side.
- Extreme applications of Zero-G will cost you more over the course of a season than you gain on Draft Day. Consider a more liberal approach to Goalies.
Ultimately, while Zero-G aims to mitigate the unpredictability of goalies, it inadvertently overlooks the consistent and superior returns provided by skaters. For fantasy hockey managers looking to maximize their points, I recommend a shift towards seeking Value Volume Goalie that allows you to prioritize skaters on the waiver wire.
Comments